Disclaimer: I was given access to Visme’s Complete plan for the purpose of reviewing the software, but I was not paid for this post.
This post contains affiliate links.
What is Visme?
Visme is an online graphic design tool which allows you to create high quality graphics easily.
You don’t have to be a designer: Visme comes with dozens of pre-designed templates, graphic elements and images which make creating beautiful content a breeze.
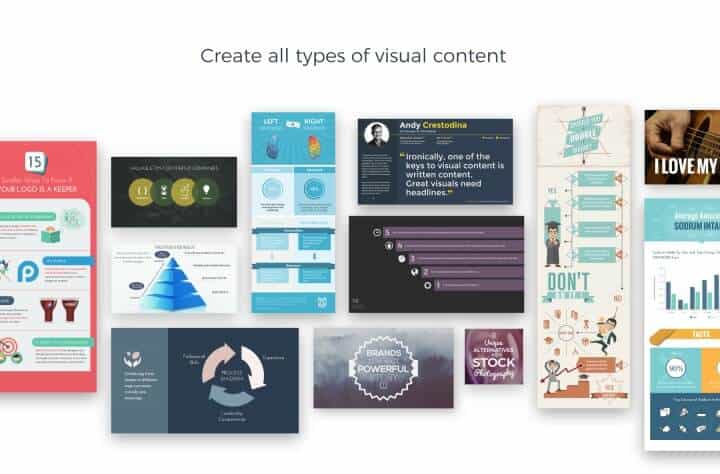
While it’s best known as an online infographic maker and presentation tool, you can use Visme to make:
- Infographics (here are tips on making good infographics)
- Presentations
- Social media graphics
- Website and blog graphics
- Printables including posters, flyers and business cards
- Documents including reports, newsletters and ebooks.

Whatever you can think of to create graphically, Visme can probably do it!
But that’s not all! Interactivity is a key feature of Visme projects. Your audience can hover over or click on elements in a graphic, revealing new information and increasing engagement. Animations, sound and video can all be incorporated into your designs.
Here’s a 2 minute explainer video:
Who is Visme for?
Visme has been created for and shaped by a wide range of users, from large corporates to solopreneurs.
Some of the many sectors who have used Visme include:
- Marketing
- Nonprofits
- Education
- Property
- Finance
- Entertainment
Visme has had a long gestation: it’s recently come out of beta after a period of 5 years. This has helped it to become mature, stable and user-led. The user base has grown to over 1.3 million, and Visme is continually being improved.
Why Visme?
Visme aims to be a one-stop shop for creating content. No more searching through dozens of websites to find photos or icons and opening multiple programs to import, edit, and save and re-import them. Visme has almost all you need in the one place, saving you time.
Other benefits include:
- No design experience required: professionally designed templates and assets are at your fingertips.
- Straightforward and intuitive interface.
- Share projects online or download in multiple formats.
- Make content interactive in a few clicks.
How does Visme work?
If you have used any software for photo editing, illustration or presentations Visme’s concepts will be very familiar.
Everything you produce starts with a canvas – either a blank one, or more likely populated by a template.
All the content you can add can be reached from the sidebar. There are 7 types:
- Layouts – blank or templates.
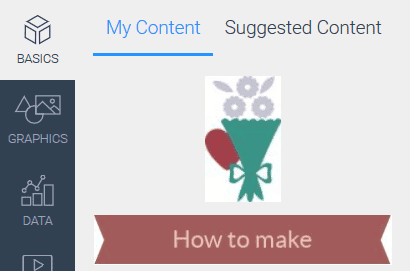
- Basics – text and text/graphic combos.
- Graphics – icons, shapes and photos for your designs.
- Data – charts, graphs and other representations of numerical data.
- Media – add video, audio or other embedded content.
- Theme Colors – adopt a preexisting colour scheme for certain elements.
- My Files – your own uploaded files.
Graphic assets
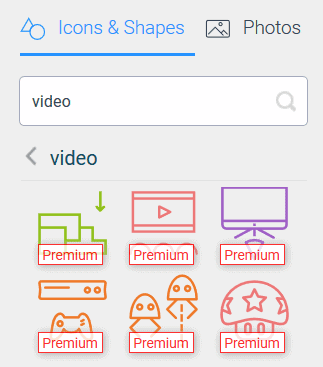
Visme comes with over 6,000 vector icons and shapes, which can be resized to any size. They are organised by type, or fully searchable.
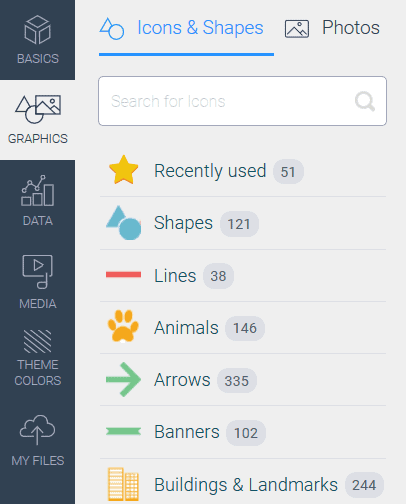
There are also over half a million free photos to search from!
Naturally, you can upload your own assets too.
Manipulating content in Visme
Items that you add to the canvas can be manipulated – resized, flipped, adjusted transparency, linked, copied, moved (above/below another object as well as on the canvas) or trashed!
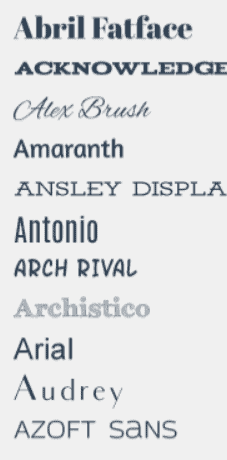
Font-wise you have a choice of over 120 fonts, and there’s all the usual typography options you’d expect – bold, italic, changing size, colour, padding, alignment, adding bullets and much more.
If you’ve used any image editing software before such as Fotor, you’ll be familiar with dragging and dropping objects and grouping things you want to move together.
Furthermore, any grouped object you have created can be saved to My Content, where you can reuse it over and over.
You can crop your own uploads within Visme – not all programs let you do this.
Vismet also lets you lock objects to keep them in place. This comes in very handy if you want to move a bunch of items without displacing one element.
Adding interactivity to your Visme creations
Data
The Data tab is rather wonderful. Here you can add charts, graphs maps and other visualizations and animate them.
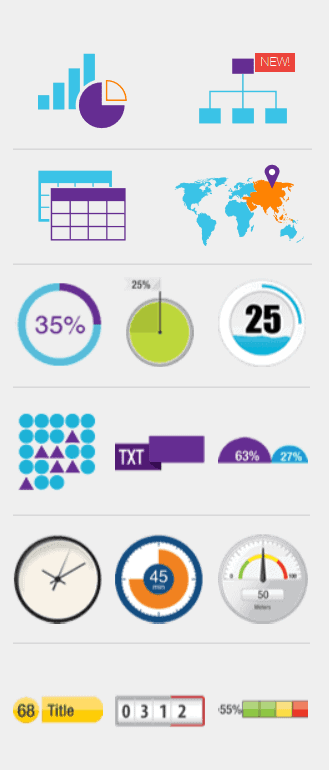
Simply upload your own chart data from a Google Sheet or Excel file – XLSX or CSV.
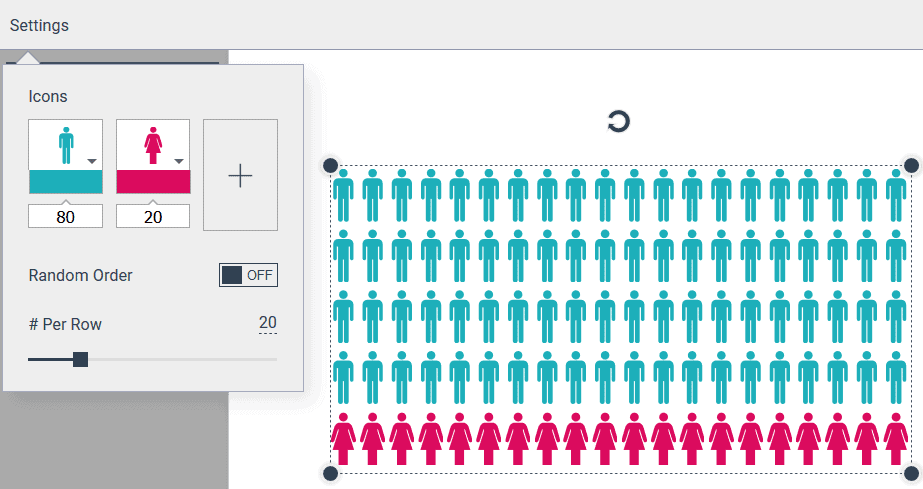
Double-click any data icon to alter the numbers.
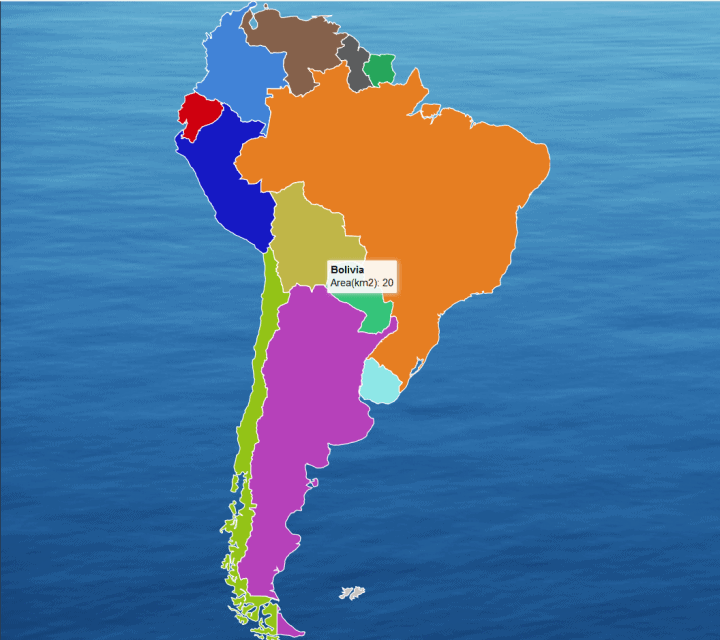
There’s also various maps you can add, recolour and add your own data to.
I love the fact that the clock and the counter tick, too!
Media
The media tab is where you can give your creations some more oomph by adding video, audio or any other embedded content.
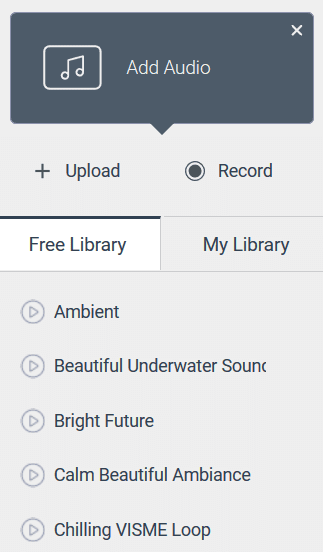
21 audio tracks are available for free. Alternatively, upload your own music or narration.
Video links can come from YouTube or Vimeo (make sure you have permission first, of course!)
Animation
Any object can be animated. There are six animated effects to choose from: fly in from top, left, right or bottom; fade in; or pop out. You control when they start and end.
I prefer the limited options here, as having and controlling too many animated effects can quickly become overwhelming. (I’m looking at you, PowerPoint!)
Some items animate automatically. For example, the infographic has a parallax scroll applied to it when you move the mouse or swipe down, and chart elements animate automatically e.g bars pop up.
Infographics and presentations
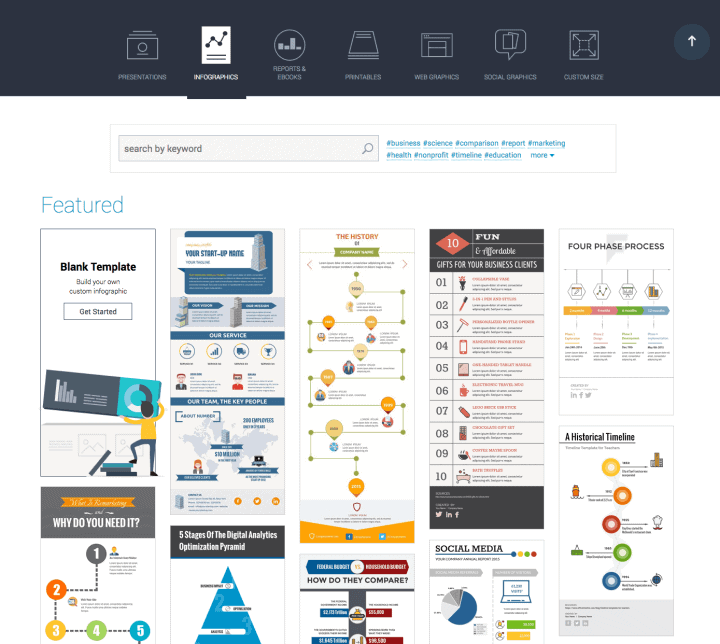
Visme has templates and tools to build stylish infographics and presentations quickly.
Infographics are built in blocks. Each block has elements laid out perfectly to add your own content.
Blocks can be moved up or down, or extended/reduced in height. You can even create your own blocks.
Presentations have two main styles to choose between, Classic and Modern. Each has subsets of slide types, so there are thousands of possible combinations.
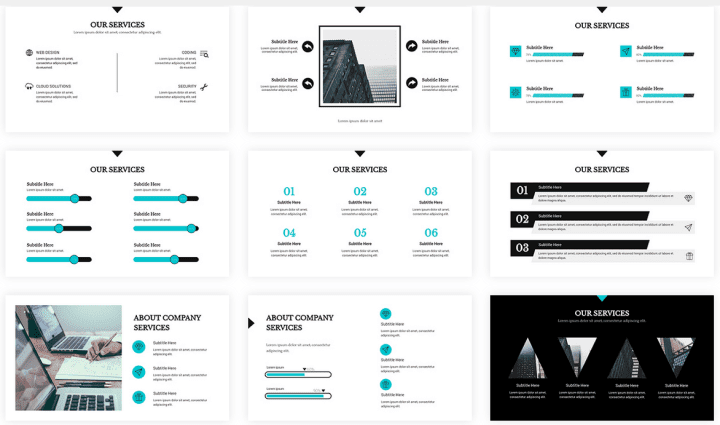
Modern style Services slide templates
A recently added feature is that you can set one slide transition across all your slides in a matter of a few clicks.
How is Visme priced?
Visme is available for free to everyone. Simply sign up at https://www.visme.co/.
You can create up to 3 projects for free and download your creations in jpg format.
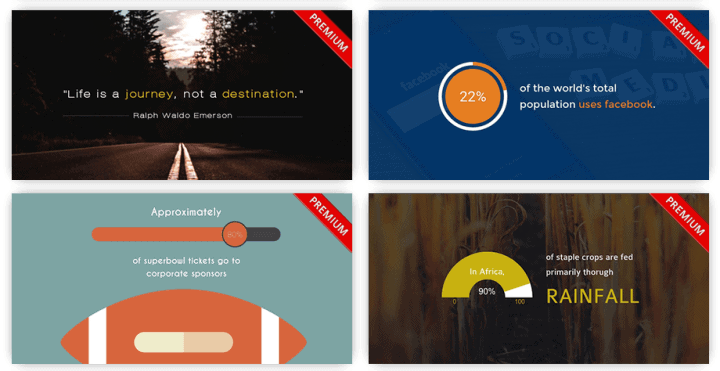
Once you seen Visme in action, you may want to upgrade to a Visme paid plan to get more templates and features. Pricing starts at $12/month for the Standard Plan with yearly billing.
There is special educational pricing for students and teachers, and nonprofits are eligible to apply for a discount.
Paid plan benefits include:
- Create more projects
- Use Premium assets and templates
- Download in other file formats – PNG or PDF (Standard plan or greater), PPTX or HTML5 (Complete plan)
- Extra storage for your own assets
- Create your own colour palettes
- Track traffic with analytics (Complete plan)
Benefits of the Complete Visme plan
Store your brand assets
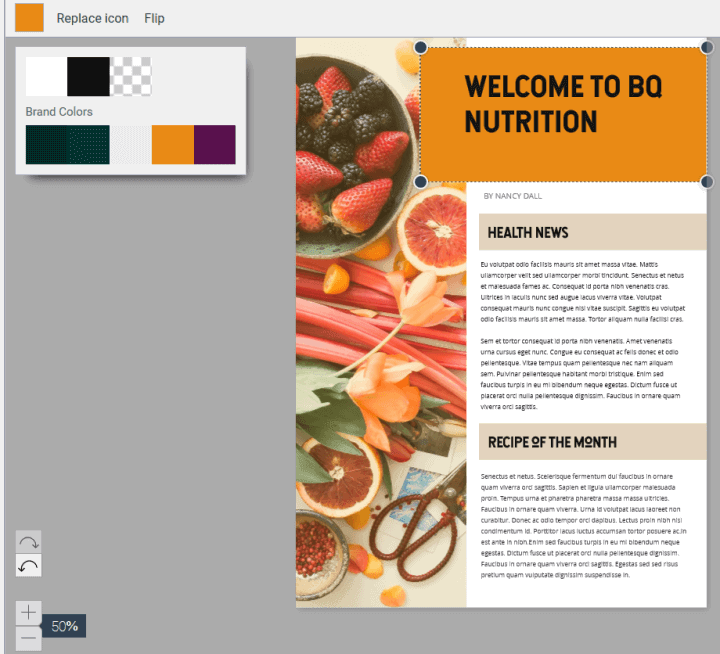
In the My Brand section you can add your own branding for reuse.
Set up to 6 brand colours and restrict them to be used across all your projects.
Can’t find your brand’s fonts in Visme? Upload your own custom fonts – they’ll appear at the head of your font list.
Set your company’s links so that they become the default for new projects.
Restrict templates to certain ones.
Add your logo across your creations.
Record your own audio
Record an audio clip within Visme and use it in your projects straight away. You can even download it.
Powerful analytics
Want to know many people viewed your Visme content? Analytics tells you not only the number of views but where your viewers came from, how long they spent on each part and whether they got to the end. Knowing this, you can strengthen anything that under-performs and share your popular content further.
Use projects to generate leads
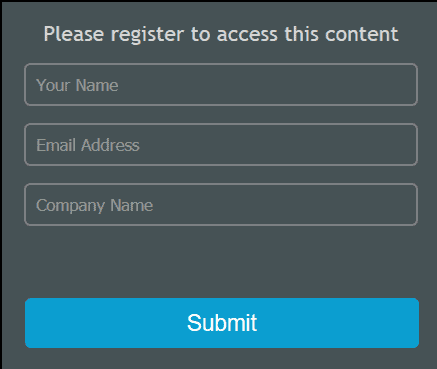
Require users to register to see your content and you can collect their names and email addresses. You can download this data in a CSV and import it to any email marketing or CRM service you use.
What would I like to see in Visme?
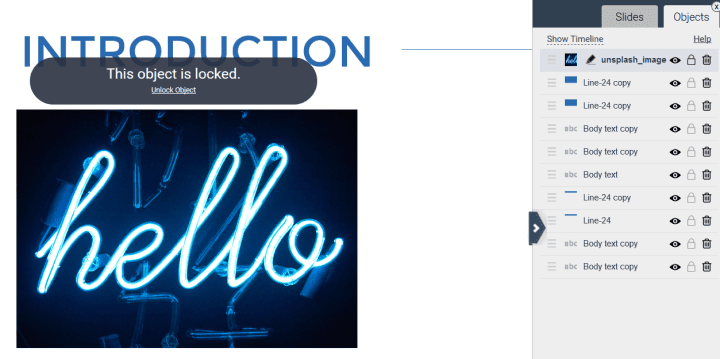
For me it would help to have a clearer visual indicator when an object is locked. You need to click on a locked object to reveal that it’s locked. Alternatively, there is a lock indicator on the Objects panel but it’s only a slightly darker grey than the unlocked symbol.
More than once I moved some infographic content that I thought was grouped: it turned out that one locked object wasn’t part of the group, and it didn’t move in sync with the rest. Unfortunately undoing the change didn’t put my stuff back in the exact same place!
One small My Brand suggestion: allow users to be able to import the values from a document rather than set each one manually.
Since accessibility is important to me, it would be good to know if Visme’s developers plan on incorporating any features into the platform to make it more accessible. For example, letting users mark images with alt text, or labelling SVG graphics with the title or aria-labelledby attributes.
What’s the verdict?
Visme is a powerful graphic creation program and online infographic maker. It saves time and money: Visme can help you create professional looking content without the need for an in-house designer.
It’s easy to pick up: Visme’s support section has tutorial articles and videos, and a regular blog with the latest tips,new features and case studies..
I like that the team responds to its users’ enquiries and feature requests to continually make it better.
Try Visme out! If you’re a startup or solopreneur, the free plan may be all you need.
People who will really benefit from Visme are teachers, nonprofits, marketers or entrepreneurs running a growing business. A paid Visme plan would be a great investment to make content that is attractive, absorbing, shareable and lead generating.


Visme is a great app for marketing. I use it all the time.